In an earlier article we covered the case where Tekvel Magic compares the configuration of data sets, reports, GOOSE and Sampled Values control blocks from an SCL file with the actual configuration of the IEDs. Today — another case: how to capture, in a single click, a snapshot of the current state of the report control blocks (URCB / BRCB) across several devices at once.
Why dig into the RCBs in the first place
Report control blocks are a «contract» between the server (the IED) and its clients (SCADA, gateways, upper-level PLCs, diagnostic tools). The server publishes data through buffered (BRCB) and unbuffered (URCB) control blocks; the client reserves the block it needs, enables it (RptEna = true) and starts receiving events on data change, quality change or periodically (or on demand). On a real substation these blocks are usually configured in the devices, but who actually uses them once the substation goes live is a separate question.
There are also clearly unpleasant cases: the reports in the devices are not reserved by anyone, while the upper-level client, instead of subscribing to events, walks every server with plain periodic polling. «Everything kind of works», but the IEC 61850 event-driven model — the whole reason for going digital — is in fact switched off. The load on the network grows, deterministic reaction is lost, events get «glued» together by the polling period, and the very fact that reports are not being used can stay unnoticed for years — until an incident review. One audit run reveals this state instantly.
Which of the blocks are currently activated in the devices on the substation? Which clients have reserved them? Which triggers (TrgOps) and optional fields (OptFlds) are set? Which data sets are wired to them and what is the composition of those data sets? What are the values of BufTm and IntgPd, and do they actually match what the design documentation said they should? These questions routinely come up during commissioning acceptance: the customer's technical representatives need to make sure the reports are actually working and actually being used — not «configured and then left idle». In the past, that kind of snapshot was assembled by hand: piece by piece, with a data-model browser, paper extracts and conversations with the integrator. Now the same comes out of a single run.
How it works
The scenario is the usual one. You are on site, a laptop running Tekvel Magic is plugged into the substation network, and the project's SCD file is on hand. You start the test — and the very first dialog asks how you want to identify the device:
- enter the device's IP address manually (when the SCD is not on hand yet, or you are checking one specific point), or
- pick the device from the SCL file — the dialog brings up a list of IEDs with their names and
descattribute (descriptions), with single- or multi-selection.
In the second case Tekvel Magic extracts the IP addresses of the selected devices from the Communication section (ConnectedAP / Address / P type="IP") and connects to each one over MMS. So with one click you can run an audit of report usage across, say, eight devices in a row — and get a separate document per device.
Once the MMS association is up, the tool reads the full data model of the device, finds every URCB and BRCB and queries their attributes — RptID, RptEna, DatSet, ConfRev, OptFlds, BufTm, SqNum, TrgOps, IntgPd, GI, Resv, Owner (for URCB), plus PurgeBuf, EntryID, TimeOfEntry, ResvTms (for BRCB). In parallel, Tekvel Magic also pulls the composition of every data set. The result is an MS Word document.
What is inside the document
When you open the document, you see an automatically generated table of contents and three main sections: connection parameters, a summary table of blocks and detailed information for each one.
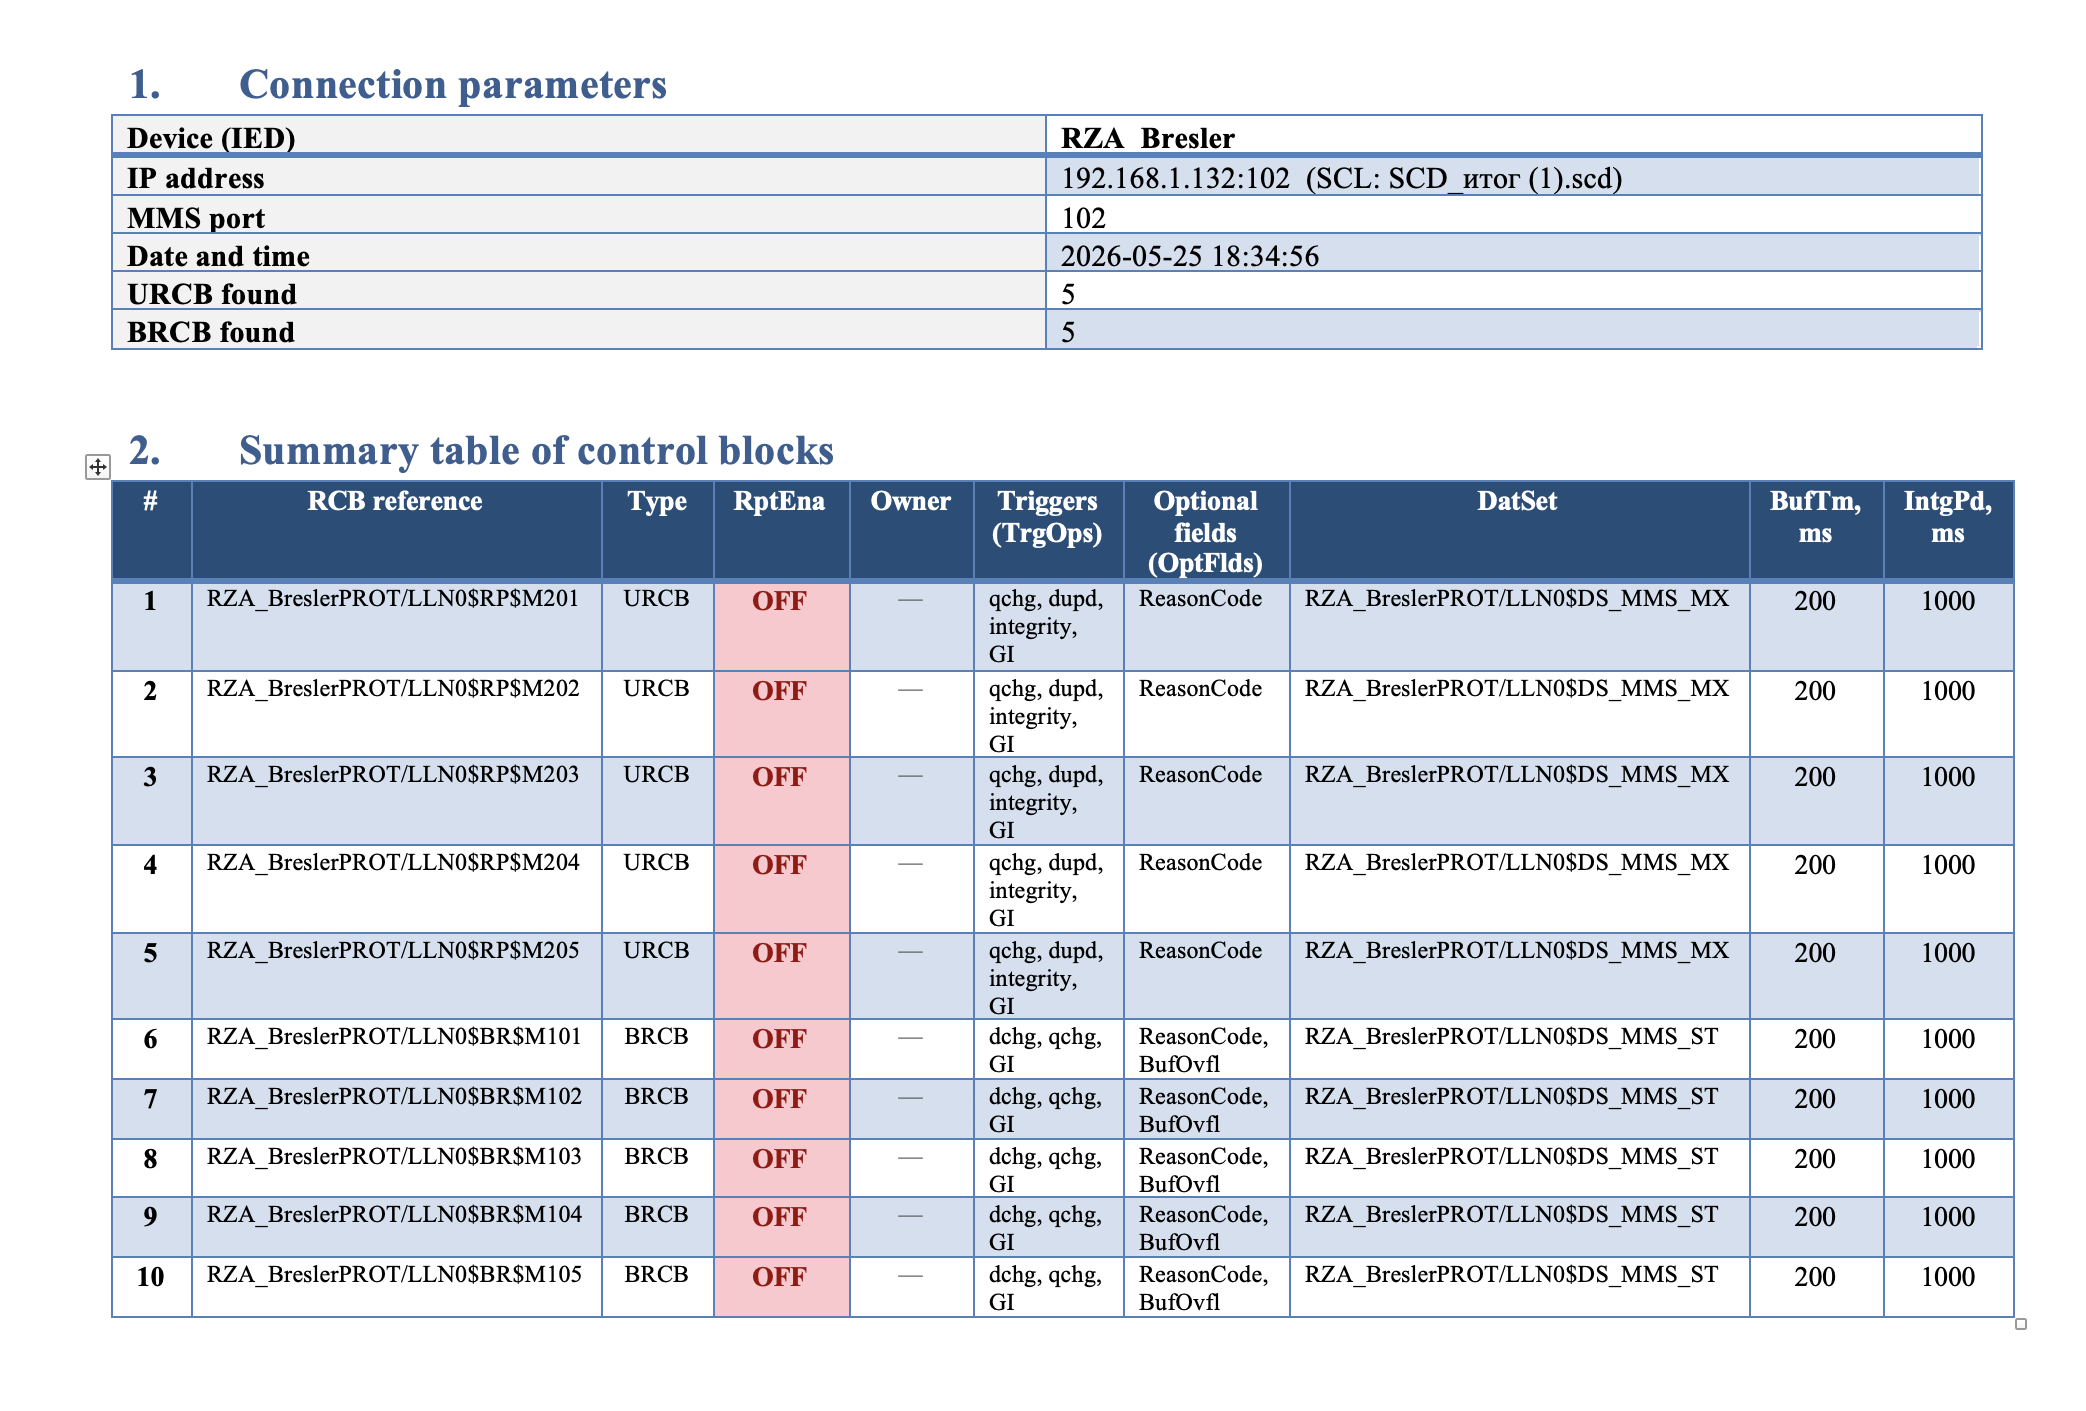
The summary table has one row per RCB. For each block the following are shown:
- the reference to the block in the device's information model (for example,
IEDName/LLN0$BR$Report01); - block type — Buffered (B) or Unbuffered (UB);
- state:
RptEna = ON / OFF; - Owner — the IP address of the owning client, if the block is reserved and the server exposes that information. We decode Owner from the raw OCTET STRING into a human form
192.168.0.42:5001; if the block is actually free, the cell shows a dash; - the set of triggers (
dchg,qchg,dupd,integrity,GI) and optional fields (SeqNum,TimeStamp,ReasonCode,DataSet,DataRef,BufOvfl,EntryID,ConfRev) that are enabled; - the reference to the data set being used, the buffer time
BufTmand the integrity periodIntgPd.
From this single table you can already see the most important thing during acceptance: which reports are configured, which of them anyone has actually reserved and whether there are blocks left dangling with no triggers enabled.
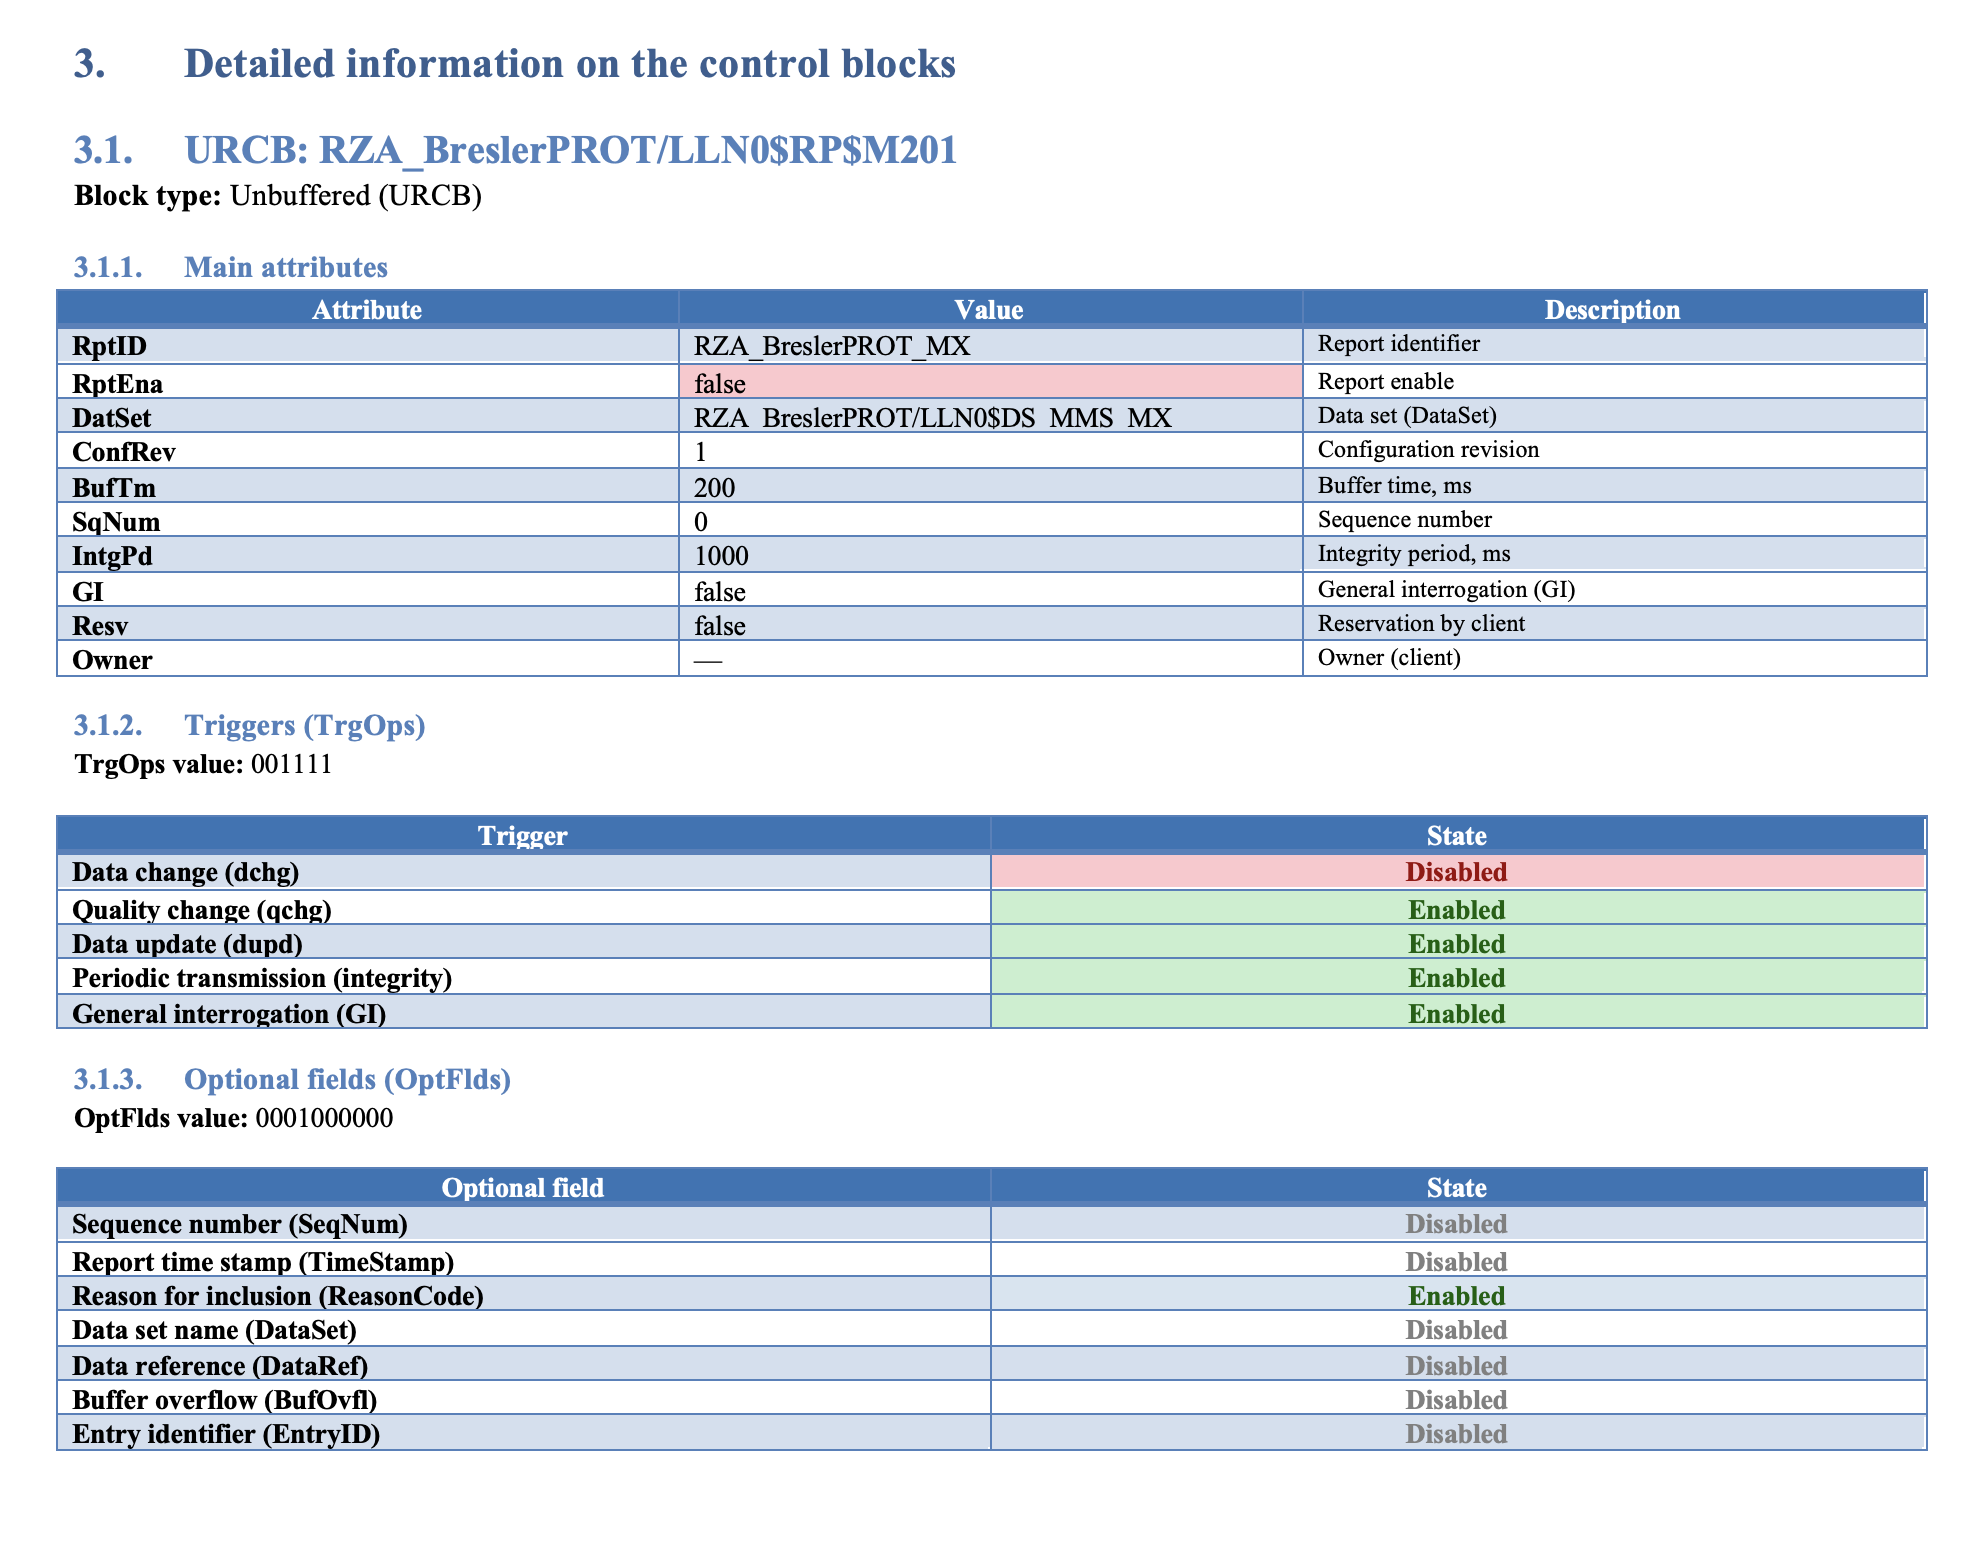
Next — detailed information for every block. Here you get the full list of attributes with descriptions, separate sub-sections decoding the TrgOps and OptFlds bit fields (one bit per row — what is enabled and what is not), the timing parameters with explanations of what each value means, and finally the element-by-element composition of the DataSet, broken down into LD / LN / DO / DA / FC columns. If an SCD file was selected at the connection stage, every FCDA additionally picks up a textual description (the desc attribute) — pulled directly from the SCL via the matching DOI. In practice this is invaluable: instead of an abstract «MMXU1.A.phsA.cVal.mag.f» you see «Phase A current» right away — and the meaning of every report falls into place in seconds.
The document is assembled with a table of contents and automatic section numbering.
What this is good for in practice
Combined with the previously presented configuration-comparison module (which reconciles reports from an SCD file against the actual IED configuration), this module closes the second half of typical SCADA questions: «how it is configured» is complemented by «how it is actually working right now». During commissioning it cuts the time spent on «why aren't the events coming through»; during acceptance it gives the commission an easily verifiable artefact; in operation it makes it possible to capture the «who is subscribed to what» picture across the whole fleet of devices in minutes. And in the particularly unpleasant cases it helps to catch the main thing: that the IEC 61850 event-driven model is formally configured on site, but in fact is not in use. One run, one protocol, one conversation with the contractor — instead of dozens of emails and improvised spreadsheets.
Enjoy using it! IEC 61850 engineering sometimes calls for a little Magic :)