On a digital substation with extensive use of GOOSE communications, the staff ran into periodic «Fault» and «Incoming GOOSE error» alarms from a number of protection and SCADA devices. These episodes occurred several times a day: the system would suddenly switch to a fault state and then return to normal operation on its own. The cause of what was happening, meanwhile, remained unclear.
Outwardly the system kept working normally:
- no equipment was tripping;
- no faults were being recorded;
- the link to the devices was not being lost;
- the IED self-diagnostics showed no failures.
It is exactly these «floating» problems that are considered among the hardest to investigate on a digital substation. An additional difficulty was the absence of an IEC 61850 online monitoring system on site, which could have automatically captured and classified abnormal events in the station's local network.
The only source of information turned out to be a pcap file about 11 minutes long, recorded by the specialists while connected to the substation LAN. It was from this capture that they had to work out what was happening with the protection and SCADA devices.
Why Wireshark is not enough
The specialists started their initial analysis in Wireshark. It is the most popular tool for working with network traffic, and it is excellent for the detailed inspection of individual packets. In incidents like this, however, the problem is not a lack of access to the data, but the scale and complexity of the analysis itself.
The engineers had a pcap file with almost 186,000 GOOSE packets and more than 200 active GOOSE sources. At that volume of traffic, the specialist sees a continuous stream of messages, within which short-lived deviations have to be found.
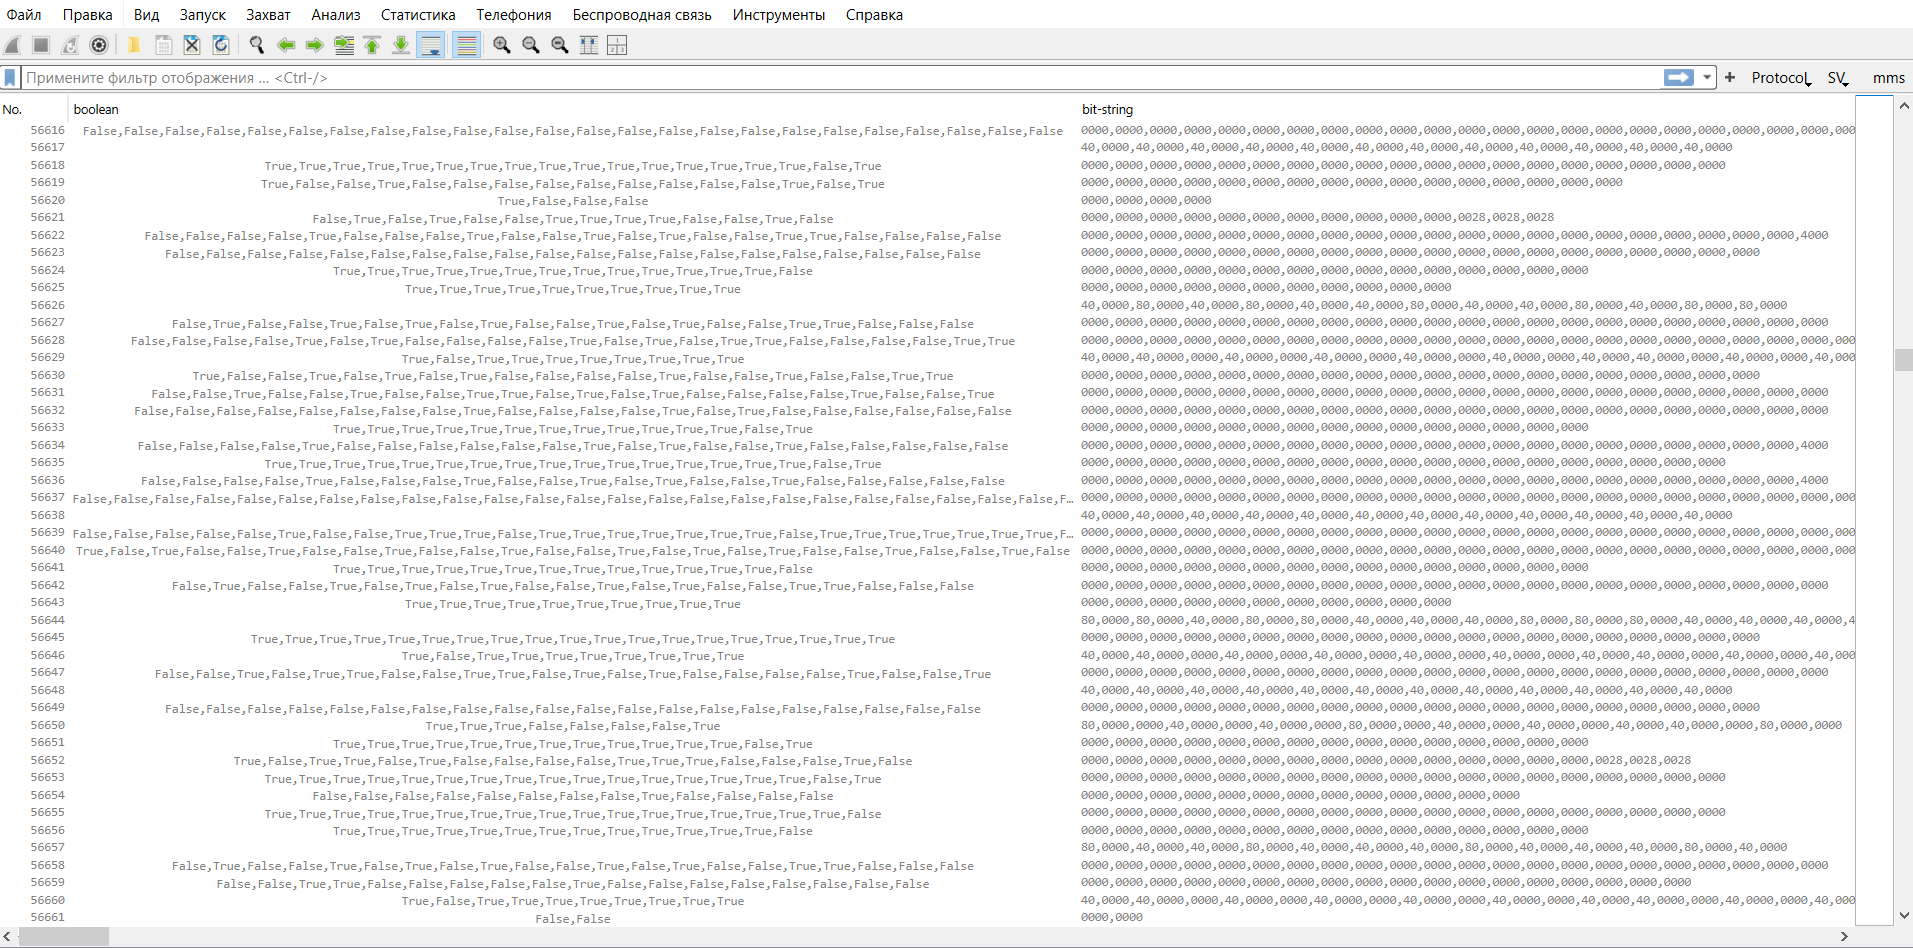
The difficulty is also that, for a manual analysis, the engineer has to know in advance exactly what to look for and where: a GOOSE dropout on the network or a change in signal quality, GOOSE delays or a time-synchronisation problem on the devices, and so on. As a result, the search for the cause turns into checking dozens of hypotheses among thousands of packets.
For example, to detect a short-lived exceedance of the timeAllowedToLive (TATL) parameter, you have to manually analyse the intervals between adjacent packets of every GOOSE message and compare them with the TATL value sent in the previous message. At this volume of traffic such a check can take hours, especially if the violation lasts only a few tens of milliseconds.
The analysis of GOOSE signal quality is no less difficult. A single publication can carry dozens of signals, and a change in even one quality bit — for example, validity switching to Invalid — is hidden inside the GOOSE structure and is extremely hard to spot visually.
In theory, all these problems can be uncovered with Wireshark. In practice, such an analysis requires many hours of manual work and still does not guarantee that the cause of the incident will actually be found.
The solution: automated pcap analysis in Tekvel Magic
The pcap file was loaded into the Tekvel Magic software — the analysis took a few minutes. After processing, the program automatically produced an Excel report that collected all the detected problem devices, events and violations together with their criticality level.
Each event is tied to a specific packet number in the pcap file. If needed, the engineer can open the relevant point in Wireshark already knowing exactly what happened. In addition, if an as-built SCD file matching the device configuration is available, then instead of a signal's index number the report shows the signal from the model and its description — which makes the situation much easier to understand.
The main thing is that the engineers no longer had to hunt for the problem by hand among thousands of packets. Instead of a large pcap file, they got a clear picture of what was happening on site.
From network traffic to a ready technical report
The result of Tekvel Magic's work is a complete report of an unscheduled inspection. The report is generated in Excel format and built on the principle of a sequential investigation — from a general assessment of the state of the equipment and the LAN to a detailed analysis of specific events and signals.
The first page is the «SUMMARY». It shows general information about the file: the recording time, a unique file code that rules out any tampering with the pcap, the number of GOOSE and SV packets and publications, and the overall conclusion of the analysis — all the detected problem devices, events and violations with their criticality level.
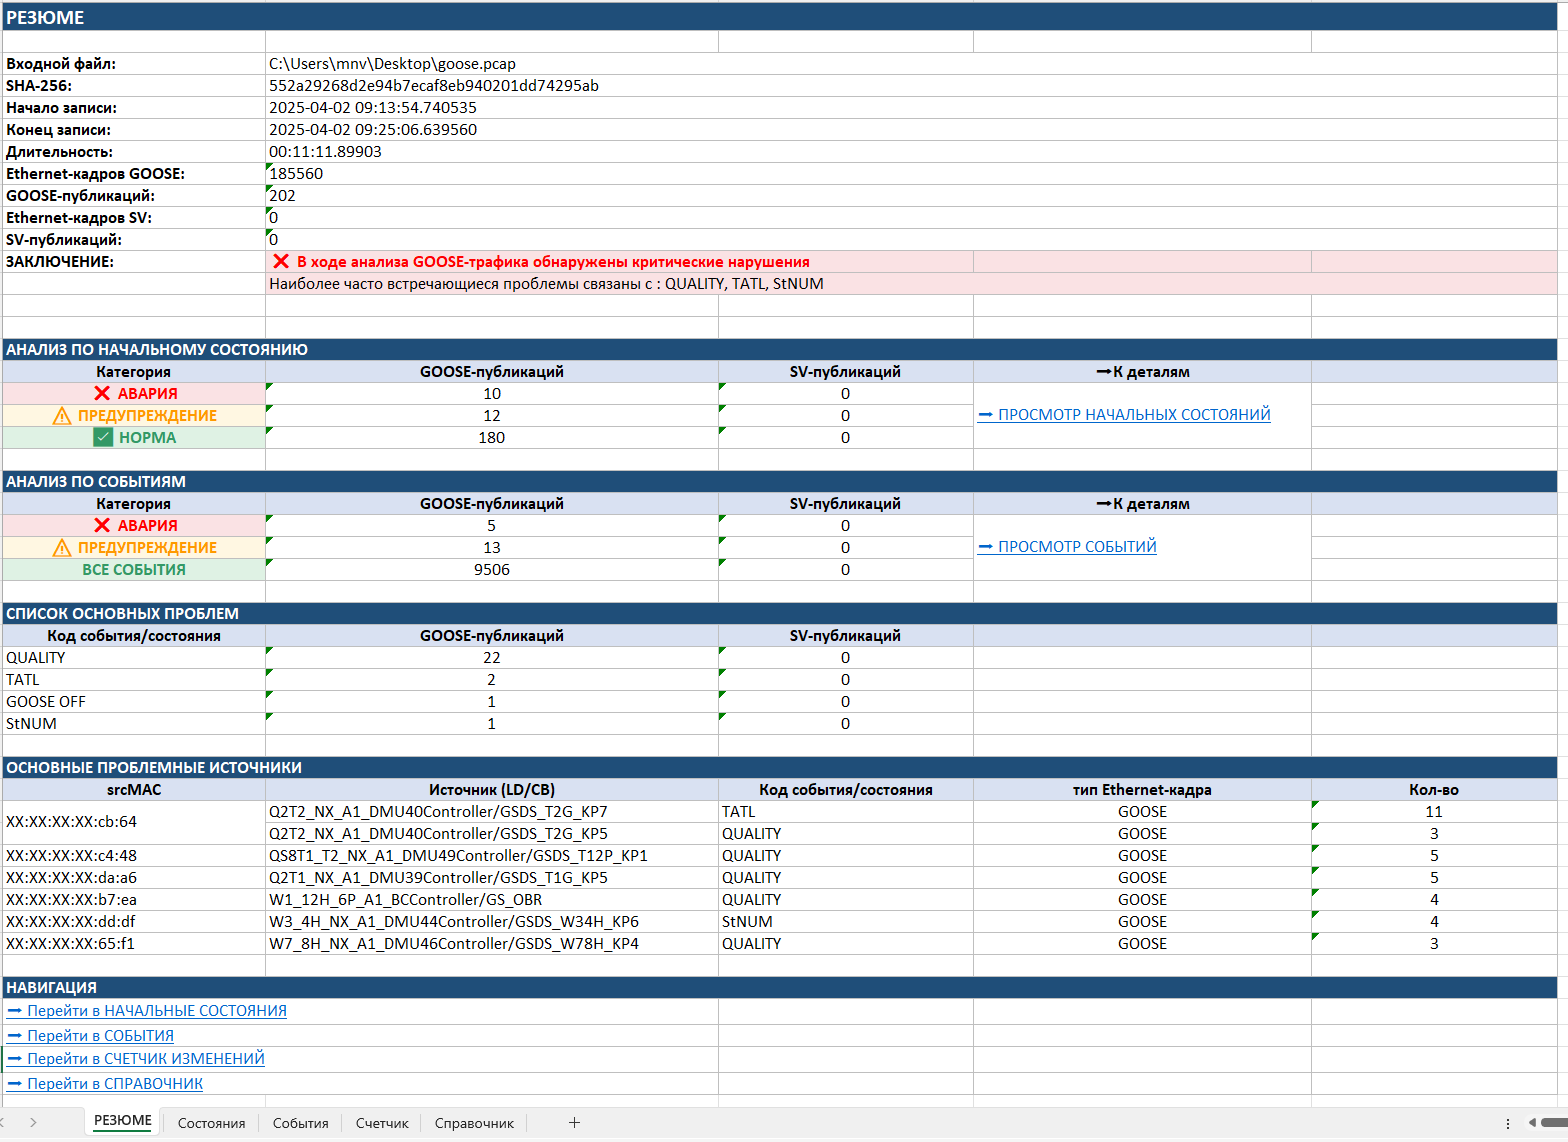
Already at this stage the specialist sees whether critical violations were found, how many GOOSE publications are in a faulted state, how many require attention and which problems occur most often. To speed up the search for causes, a list of the most problematic source devices and a list of the main types of violations are also produced. In effect, the «SUMMARY» makes it possible to answer, in a few seconds: is there a problem on the network, and where should it be looked for first.
The next stage of the investigation is «States». It shows the state of all publications at the moment the traffic recording began. Practice shows that many problems exist even before the staff start their investigation.
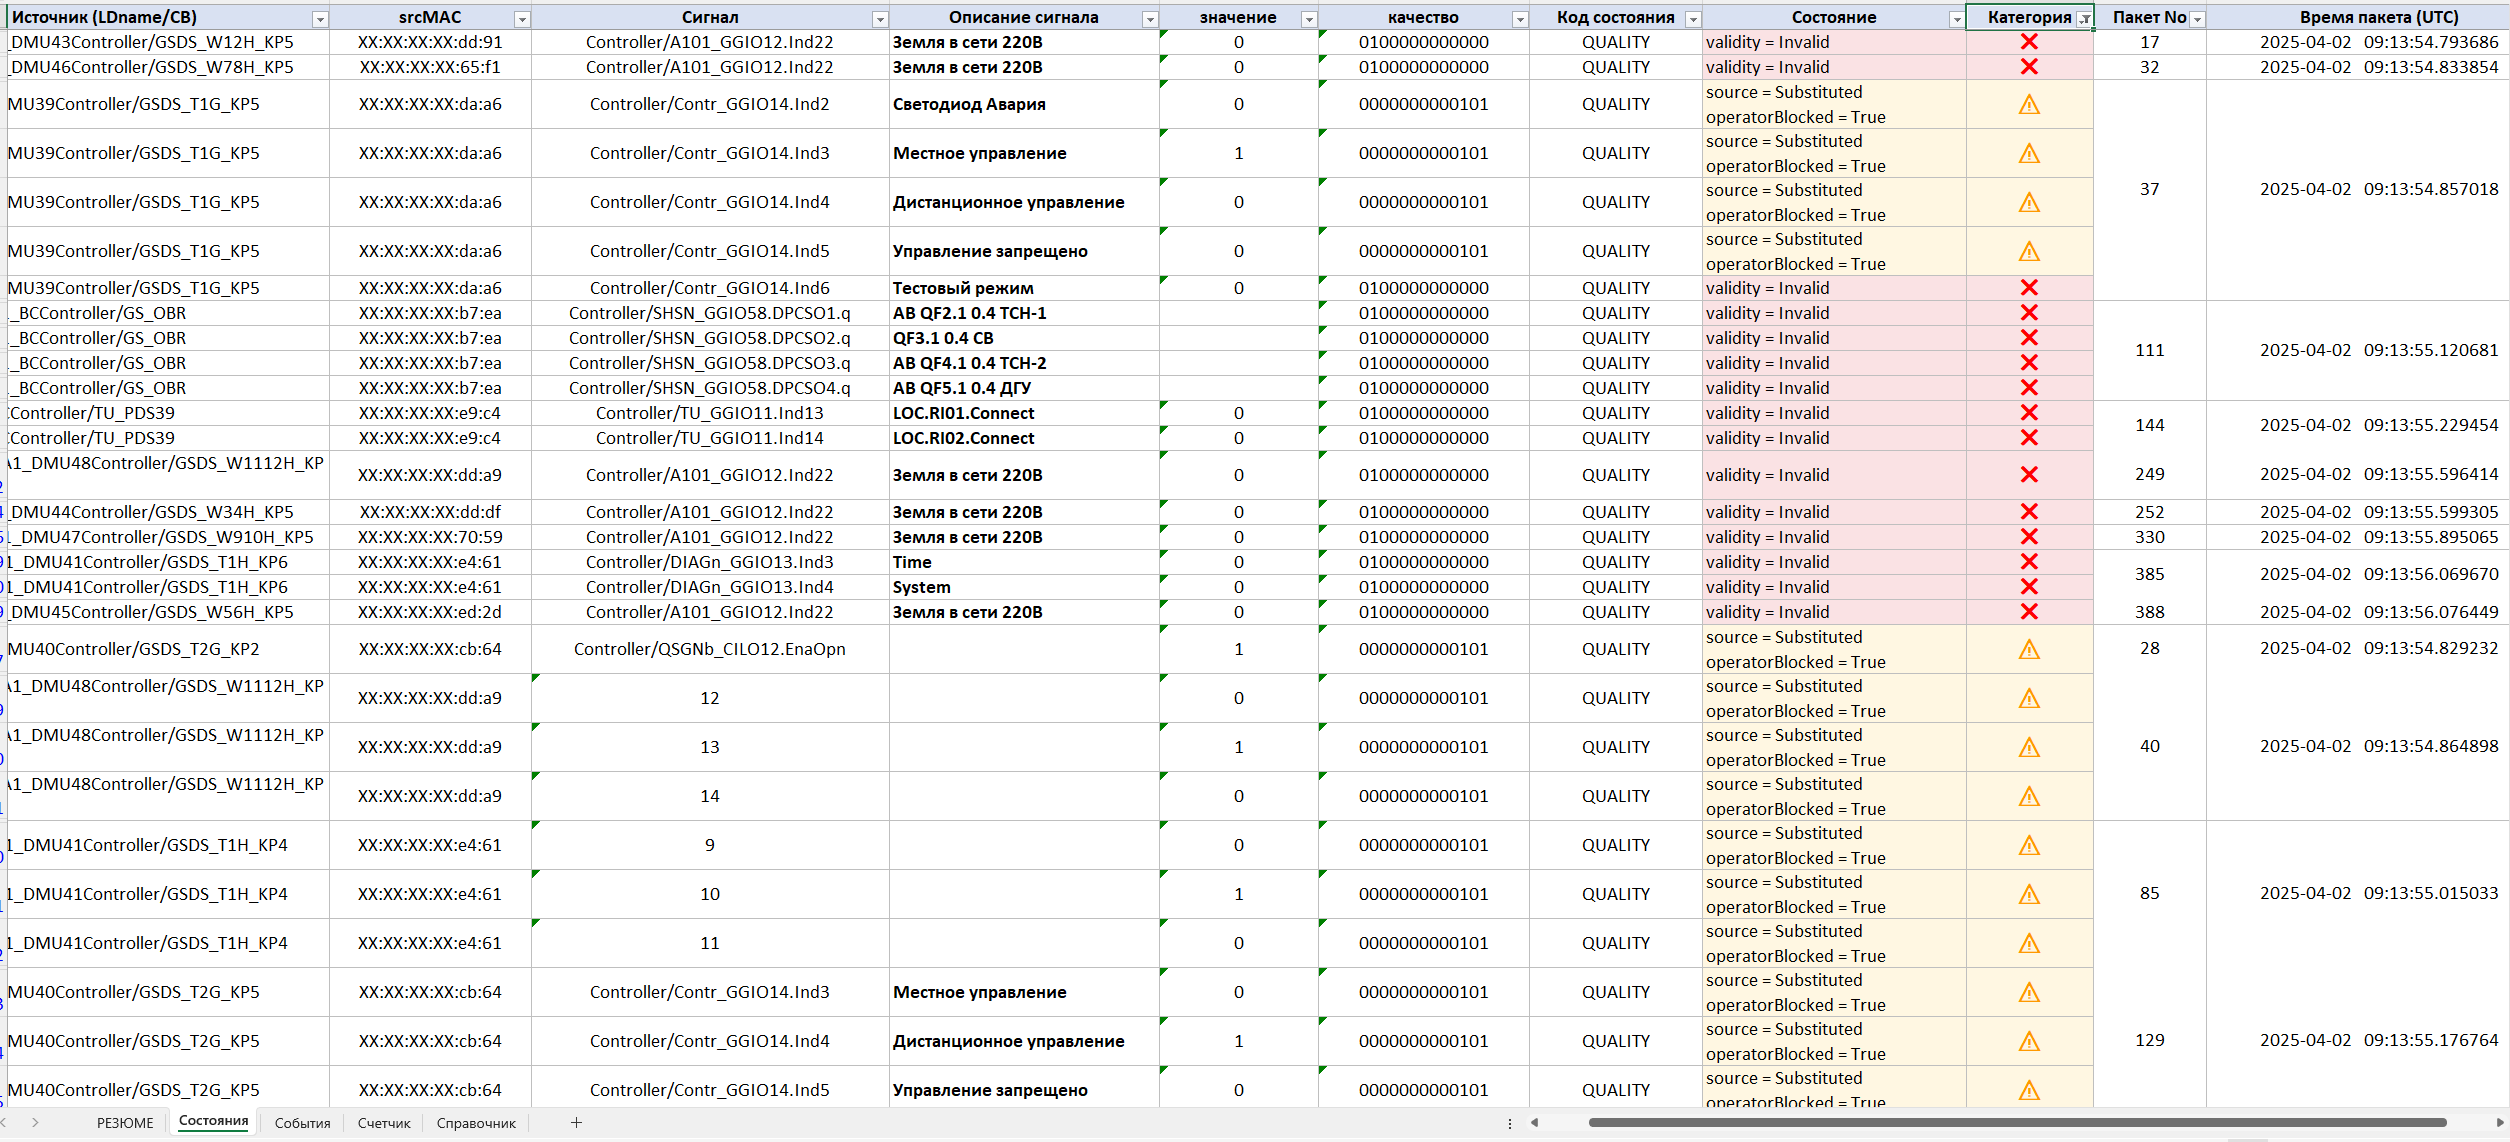
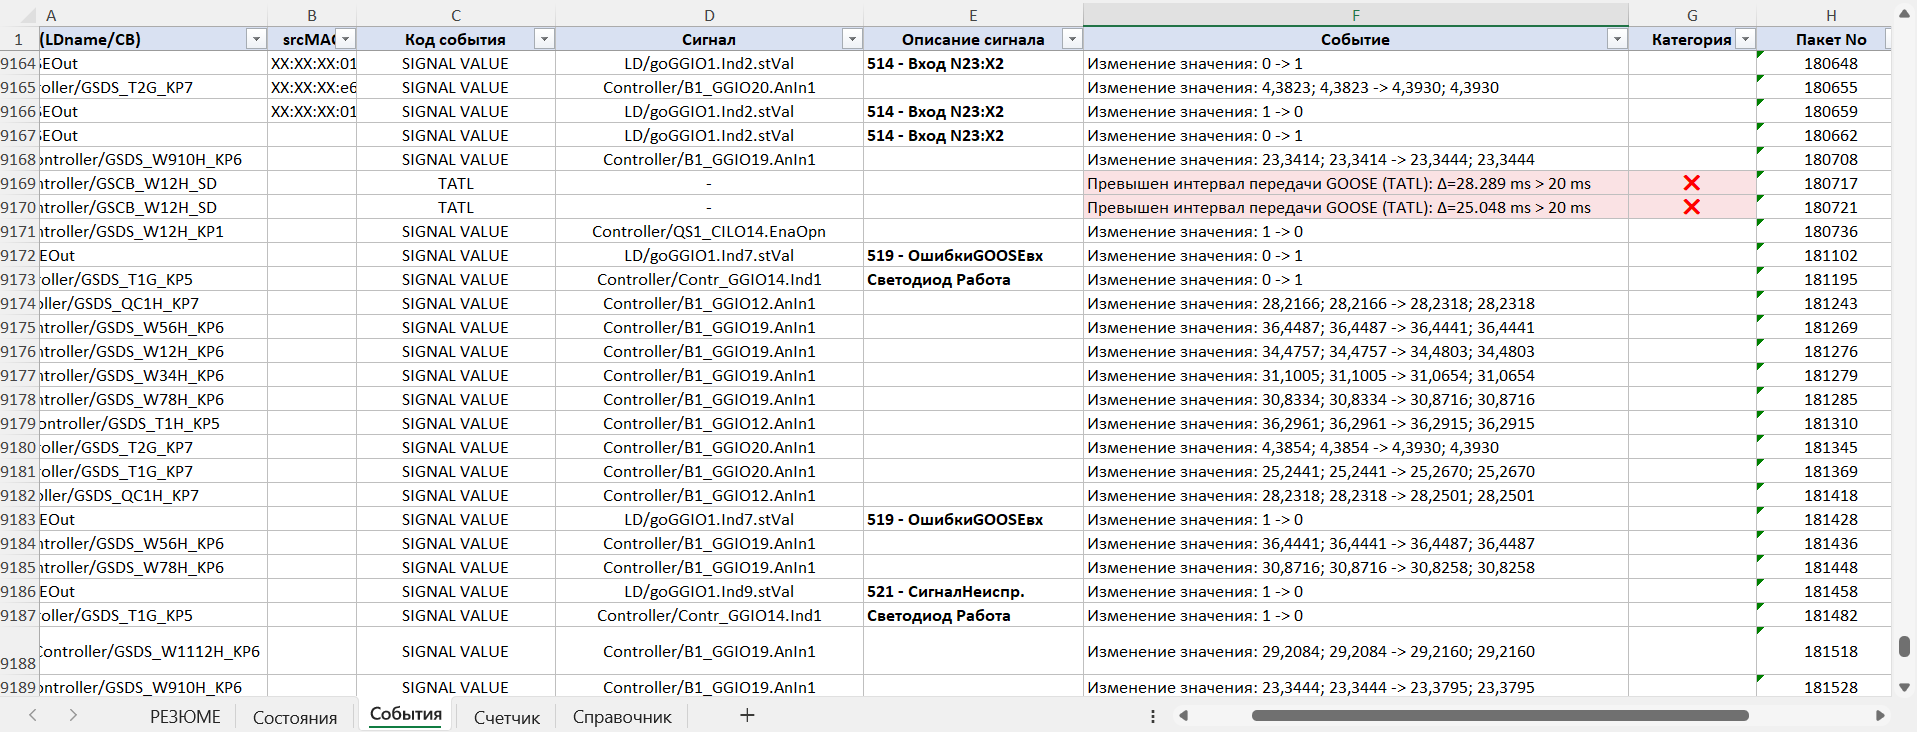
After assessing the initial state, the engineer moves on to the «Events» section, which is the main investigation tool. Here all the changes in the data are shown in chronological order, together with their categorisation by criticality. For each event the following are given:
- the source (LD/CB);
- the device srcMAC;
- the signal;
- a description of the violation;
- the criticality category by its impact on the operation of the protection and SCADA systems;
- the packet number;
- the exact time of occurrence.
Thanks to this, the specialist can see the very fact of a violation:
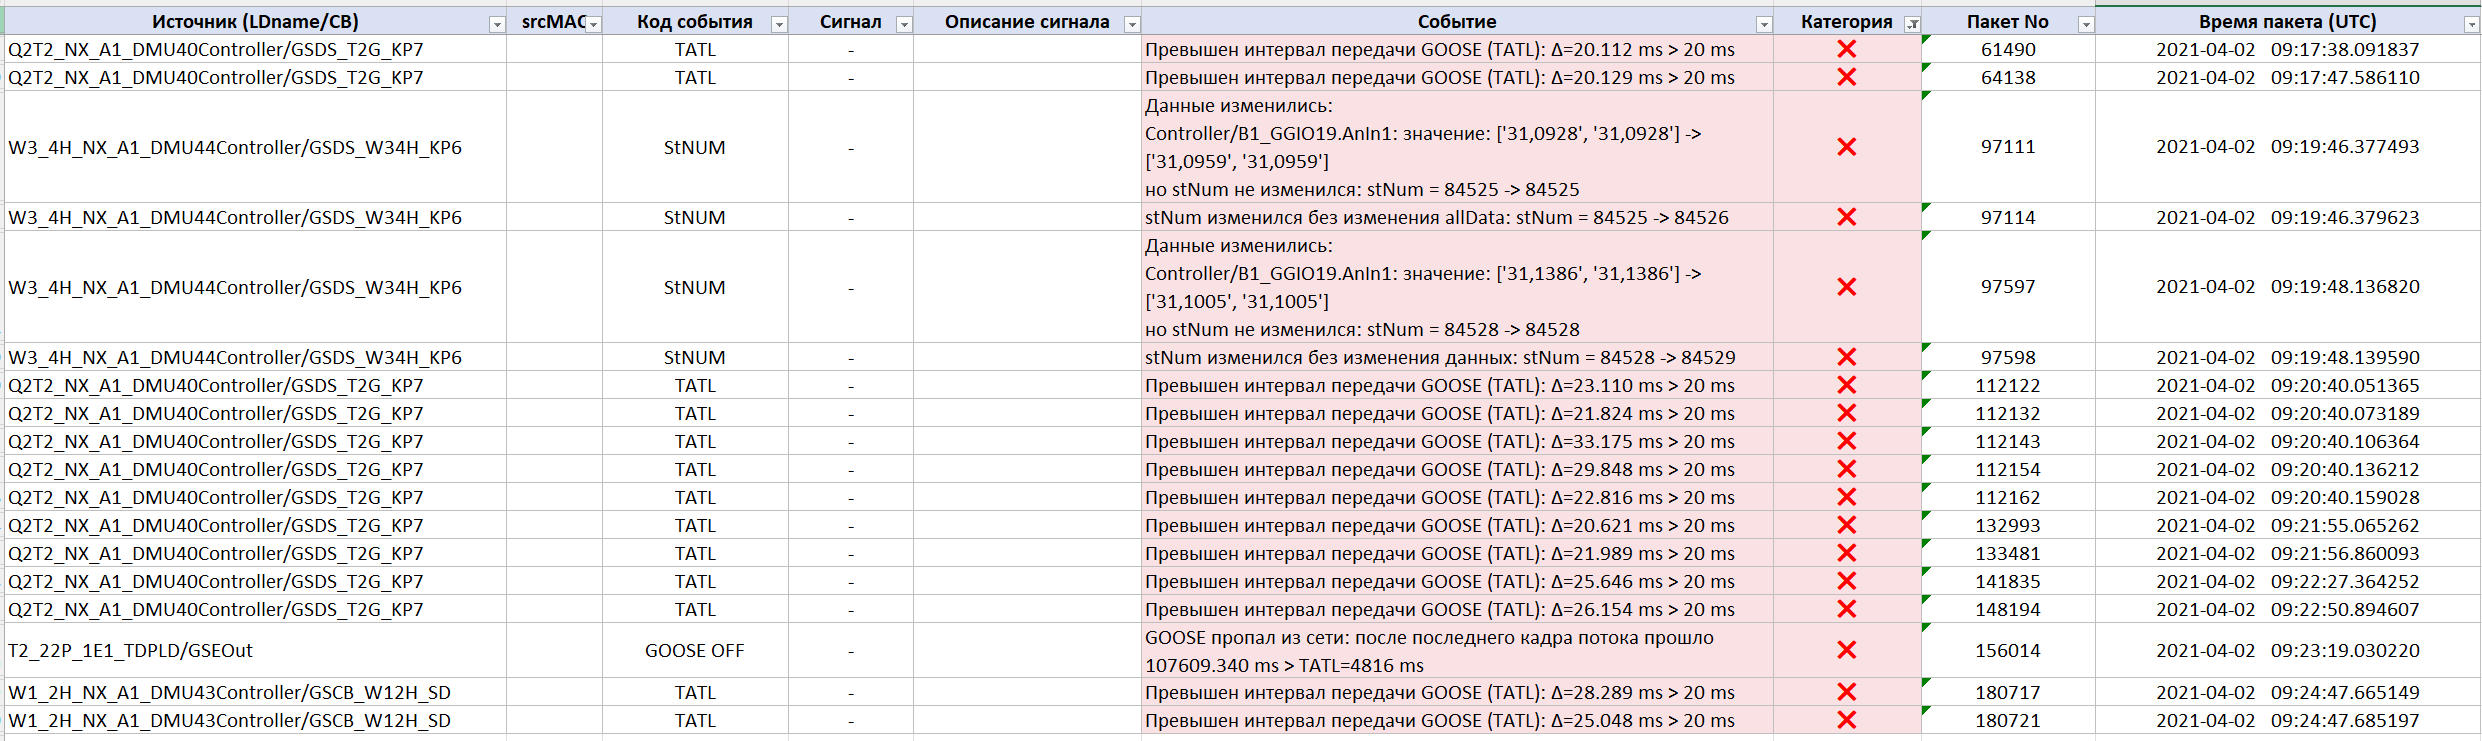
…and trace the sequence of events that led to the problem on site:
The next section is the «Change counter». It shows which signals changed most often during the recording. For each signal it calculates the number of changes and their average frequency in a sliding one-second window. This kind of analysis makes it possible to quickly detect unmotivated and/or excessively frequent changes in signal states, an incorrectly configured deadband and other processes that can place an increased load on the LAN equipment and on the protection and SCADA devices themselves.
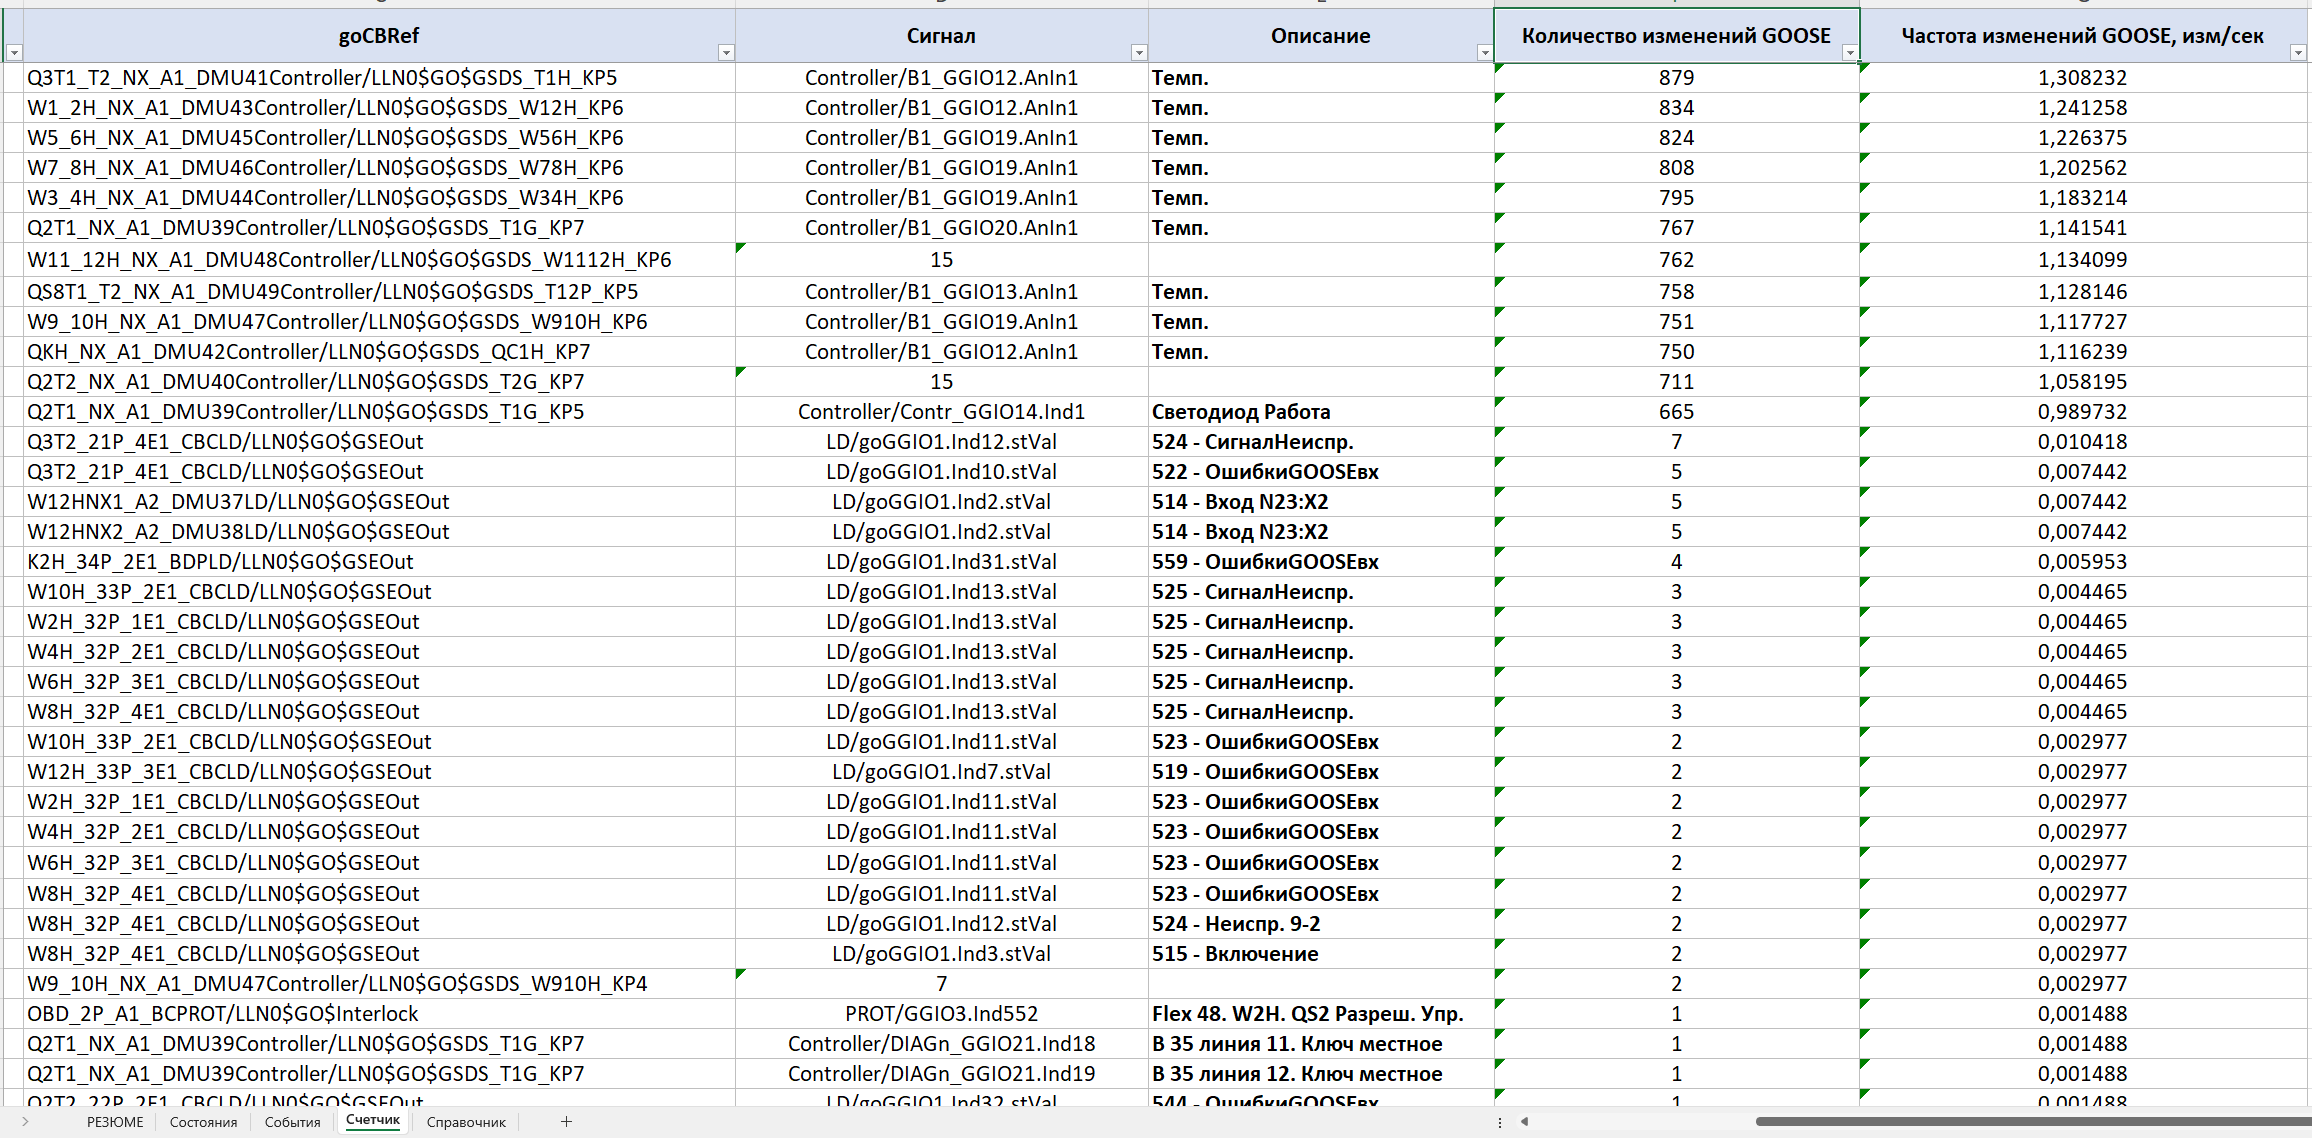
In the example under consideration, it was precisely this section that made it possible to see the signals that changed 600–800 times over the 11 minutes of recording and in effect generated the bulk of the event traffic.
The last sheet is the «Reference». It contains a description of all the monitored analysis criteria, the event codes, the rules for classifying violations and explanations of what each detected violation may lead to. Thanks to this, the report stays understandable not only to the specialist who carried out the analysis, but also to colleagues, equipment manufacturers or representatives of the operating organisation.
In this way, Tekvel Magic turns a pcap file into a structured incident investigation. The engineer gets an overall picture of what is happening, a list of problem devices, a full chronology of events and the ability to jump to a specific packet in the original traffic dump if an additional check is needed.
What was found on site
Critical TATL exceedances
The main cause of the cyclic «Faults» turned out to be related to a violation of the timeAllowedToLive (TATL) parameter. For one of the GOOSE streams, the system recorded regular exceedances of the permitted interval between packets: with TATL = 20 ms, the actual intervals periodically reached 33 ms. In one episode, five consecutive violations occurred in a row — for the subscribing devices this meant a halt in receiving information from the publishing device.
A complete disappearance of a GOOSE message
In addition, Tekvel Magic detected an event in which one of the GOOSE streams disappeared from the network completely for almost two minutes:
- the GOOSE absence — more than 107 seconds;
- the interval permitted by TATL — 4816 ms.
In a manual Wireshark review, such an episode is practically impossible to notice among hundreds of active publications.
Faults in the GOOSE stNum counter
The system also identified incorrect operation of the stNum state counter:
- the data in the GOOSE message changed, but stNum did not increment;
- then stNum incremented without any change in the data.
This is a sign of abnormal GOOSE-publication behaviour, capable of leading to a misinterpretation of events by the receiving devices.
Data-quality problems
In several publications the validity = Invalid attribute was found. Moreover, some of the violations were already present in the initial state of the recording — that is, the problem existed even before the moment the specialists considered to be the start of the unscheduled inspection.
Conclusions
The «floating» fault, hard to localise with the usual tools, turned out to be not a single error but a whole set of interrelated GOOSE-traffic violations: periodic TATL exceedances, short and long publication dropouts, stNum counter faults and a degradation of signal quality. Each of these violations is short in time on its own and easily lost in the overall stream — which is exactly why the manual analysis in Wireshark produced no result.
With the Tekvel Magic software, turning the 11-minute capture into a structured report took a couple of minutes instead of many hours of manual work — and it delivered a result that the manual analysis did not guarantee.
One systemic lesson is worth emphasising separately: the absence of permanent monitoring (an IEC 61850 online monitoring system) on site turns any incident into a one-off «field» investigation based on a randomly recorded capture. Where such a system is installed, events such as TATL exceedances, GOOSE dropouts and stNum faults are captured and classified continuously — and most «floating» faults cease to be a mystery. But even when there is no continuous monitoring, the Tekvel Magic software makes it possible to carry out a full investigation after the fact: load the pcap, obtain a technical report and make an informed engineering decision.
Real magic — but entirely an engineering kind.